- Risk sentiment falters
- US 500 index is in the red again today
- Momentum indicators could turn bearish
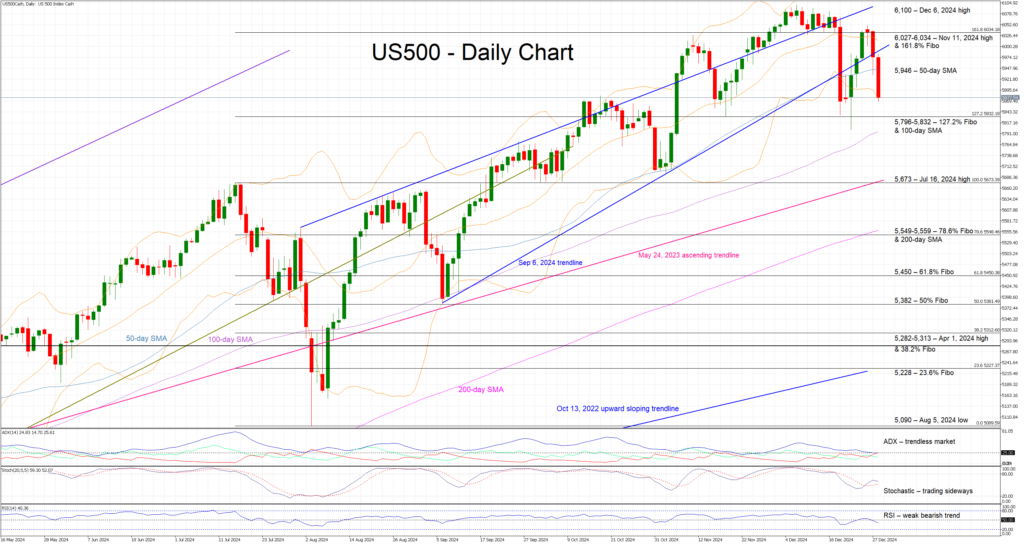
The US 500 cash index is trading lower again today, dropping below both its 50-day simple moving average (SMA) and the September 6, 2024 trendline, as risk appetite is faltering in the final trading sessions of 2024. The US debt ceiling debate, uncertainty about Trump’s second term and the overall low liquidity conditions are contributing to the current correction in stock indices.
Meanwhile, the momentum indicators are mostly mixed. The Average Directional Movement Index (ADX) is trading sideways, below its midpoint, signaling an almost trendless market. Similarly, the RSI is now edging below its midpoint level, pointing to a small buildup of bearish pressure in the US 500 index. Interestingly, the stochastic oscillator is hovering a tad above its moving average, showing little appetite for a forceful move. Should a downward breakout take place, it would be seen as a strong bearish signal.
If the bulls remain confident, they can try to keep the US 500 index above the busy 5,796-5,832 range, and gradually push it above the 50-day SMA at 5,946. Provided they overcome the September 6, 2024 trendline, the bulls would then most likely face strong resistance at the 6,027-6,034 region. This area is populated with the November 11, 2024 and the 161.8% Fibonacci extension of the July 16, 2024 – August 5, 2024 downtrend. Even higher, the next target would be the December 6, 2024 high at 6,100.
On the other hand, the bears are keen for the current correction to continue. They could push the US 500 index below the busy 5,796-5,832 range, which is defined by 127.2% Fibonacci extension and the key 100-day SMA, and then set their sights on the 5,673 level.
To conclude, weak risk sentiment is driving the US 500 index lower in the last sessions of 2024. However, for the current correction to gain significant momentum, several key support areas below the the 5,796-5,832 range must be broken first.